Market Commentary: June 2022
Global Market Themes: Global markets experience their worst first half in decades Global recession fears rise Central Banks remain steadfast in their resolve to tame inflation Sovereign debt and fragmentation risks flare up in Europe Japanese Yen weakens to multi-decade lows SA Market Themes: Resources bleed as global commodity prices fall Eskom implements Stage 6 loadshedding Inflation breaches the 6% level
Market View
Global Market Themes
The first half of 2022 is one for the record books. Global equity markets endured their worst first six-month period in over 40 years. The MSCI World Index declined 21.2%, while Emerging Markets (MSCI EM Index) lost 18.8%. Fixed income markets were not exempt from the pain, offering investors no respite as the traditional negative correlation between equities and bonds has not held over these past six months. The global bond market bellwether (the Bloomberg Barclays Global Aggregate Bond Index) lost 13.9% in the first half. US 10-year Treasuries, one of the global financial system’s most important securities due to its use as risk-free collateral, saw its yield double from 1.5% in December to 3% as it closed out in June. All returns are in USD.
Such extreme moves were displayed across all markets; equities, bonds, commodities, currencies etc.
“Traditional asset class relationships have broken down as most investors have had to navigate a new and foreign investment landscape: the dominance of inflation over economic growth.”
We have written in previous months about how the response function to the rise of persistently high inflation has been very aggressive global monetary policy tightening, led by the US Federal Reserve. This has forced investors to recalibrate their outlook and current positioning.
With the above as context, June added a new dynamic: broader market recognition and the likely pricing-in of US and global recession risk. Investors have woken up to the negative impacts on economic growth due to the rapid rise in interest rates. Typically, monetary policy works with a time lag of 12 to 18 months between a change in interest rates and the full impact shown in the economy. Investors are concerned that the rapidity and magnitude of the rate rises over the six months will likely mean a material slowdown in growth, if not a severe recession in coming quarters.
In the US, the latest annual CPI inflation print was higher than expected (8.6% actual vs 8.3% consensus). The underlying data revealed a broadening of price pressures, while annual energy inflation accelerated further and is a primary contributor to the headline number, thanks to elevated global energy prices. This latest CPI inflation report reaffirmed that aggressive monetary policy tightening remains the default path forward; Federal Reserve chair Jerome Powell said as much in press remarks following the bank’s latest policy meeting, where the committee voted to increase the key reference rate by 75 basis points, the largest increase since 1994.
“Regarding markets, the S&P 500 fell 8.39%, entering bear-market territory, having fallen more than 20% from all-time highs in early January. The more interest-rate sensitive NASDAQ 100 lost 9.0%, down more than 30% from all-time-highs.”
The US 10-year treasury yield reached an intra-month level of 3.5%, having moved 70 basis points higher from the start of the month as this market digested the latest inflation data, released mid-month, and its implications for interest rates. However, the latter half of June saw the 10-year yield fall by 50 basis points in rapid succession as markets began to recognise US recession risk.
The UK latest manufacturing PMI data for June came in weaker than expected, printing at the 53.4 level compared to a consensus of 53.7. This metric continues to indicate that the UK economy remains firmed in expansion territory. However, the declining trend in this series is of concern for investors as it signals slowing growth. This data series has incrementally fallen from 58 in late Q4 2021 to its most recent reading of 53.4. Inflation woes grew as the May reading of 9.1% is the highest annual figure since 1982. The Bank of England was less aggressive than its US counterpart at its June meeting, raising its key rate by 25 basis points, taking the rate to 1.25%, a decade high. The FTSE 100 Index declined by 7.2%, and the UK 10-year yield rose by 13 basis points to close the month at a yield of 2.23%.
June saw the return of Eurozone debt concerns and worries about fragmentation risks as the difference or spread between sovereign bond yields of peripheral countries such as Italy and Greece rapidly expanded relative to the German bond yield. Markets moving in this way indicate investors are wary of the European Central Bank (ECB) stepping back from providing market support.
“The bank, through its various Quantitative Easing (QE) programmes over the past 10 years, has played a vital role as a primary buyer of Eurozone sovereign debt.”
Due to the pandemic, these countries have issued more debt at an accelerated pace, further deteriorating their public finances. The ECB has effectively kept these countries afloat more recently. As inflation has accelerated across the region, the bank has started to remove its bond market intervention and indicated that it would look to raise short-term rates from July onward. Thus, last month saw a material repricing of sovereign debt risk, with the Italian 10-year yield leaping to a yield of 4.3%, a massive intra-month move of 1.3% based on where it opened. Similarly, Spanish 10-year debt moved a full 1%, hitting a high of 3.2%, a level last seen in early 2014. To quell markets, near month-end the ECB announced a new anti-fragmentation tool to defend the borrowing costs of peripheral countries. The exact details of this tool remain to be clarified. This appears to have calmed markets, at least in the near term, as yield volatility settled somewhat at month-end.
The stark divergence in monetary policy in Japan relative to the US has likely been the primary driver of the Yen’s weakness in June.
“USDJPY broke key technical levels in June, breaching the 135 level vs the US Dollar, a level at and above which it traded 24 years ago.”
The Bank of Japan’s (BOJ) loose monetary policy stance through yield-curve control, a tool through which it caps 10-year Japanese bond yields at 0.25% using unlimited QE, has meant a suppression in long-term yields relative to rising yields in the US. Investors thus find the latter country’s yield more attractive than Japan and move capital into the US bond market from the Japanese equivalent, and in doing so, would need to aggressively sell the Yen to realise US Dollars. The rapidity of the currency weakness represents a material dilemma for local policymakers: a weaker currency means energy imports cost more, in addition to already elevated global energy costs, meaning it is importing inflation from abroad. When the BOJ is unable to raise short-term rates to combat inflation, should it need to, it would likely also need to terminate its yield curve-control programme to fully implement tighter monetary policy.
Chinese equities bucked the broader equity market trend in June; the MSCI China Index rose by 5.7%, a second consecutive month of gains. The most recent economic data from the world’s second-largest economy show tentative signs of a possible bottoming of the economic fallout caused by the severe lockdown restrictions seen in May. Caution is warranted, however, as the impacts on supply chains and general activity will likely remain for the foreseeable future. Further, the ‘Zero-Covid’ policy remains in place, meaning the risk of new lockdowns continues to loom large over the Chinese people and their economy. President Xi Jinping, addressing a BRICS virtual summit in late June, reaffirmed the leadership’s commitment to meet the country’s “social and economic development targets for 2022 and minimise the impact of Covid-19.” What that means exactly in policy terms remains to be seen in the second half of 2022. All returns above are in USD.
South African Market Themes
Local equity and debt markets suffered the same fate as global peers in the first half of the year. The All Share lost 12.0% over the period, while the 10-year bond yield moved from a yield of 9.8% at the beginning of 2022 to 11.0% at last month’s close. June performance was a continuation of these declines: lower equities and higher bond yields. The same headwinds impacting global markets persist locally too; as a small, open economy, the fate of SA’s markets remains deeply interlinked to our international peers. At a super-sector level, Resources fell a massive 16.3% in June as broader commodity markets likely fell off the back of concerns about global recession risks. Oil markets are the last-man standing in the commodity complex as all other major segments – precious metals, industrial metals, agricultural commodities etc.– all declined in June and for the second quarter. Industrials faired better, although down by 5.35% in absolute terms for June. The Naspers-Prosus rally greatly aided the overall sector here. Lastly, Financials faired terribly last month, down 15.9%.
Local markets were negatively impacted by Eskom’s introduction of Stage 6 loadshedding in the final week of June, this due to illegal strike action. According to the Council for Scientific and Industrial Research, the amount of energy shed in the final week of June was 36 000 gigawatt-hours, the highest on record. Economic impact studies undertaken by Eskom and various domestic economic bodies estimate the theoretical economic impact of Stage 6 loadshedding, should it last for 24 hours, to be a R14.6 billion knock to GDP.
“A full month at this stage would cost the economy R440bn and place approximately 18 700 jobs at risk.”
However, the continuation of Stage 6 loadshedding is highly unlikely. A more realistic scenario is ongoing Stage 1 and 2 power cuts, which would have a theoretical economic cost of R73bn and R147bn, respectively, should each scenario last for a cumulative 30-day period. It is likely that loadshedding under these two stages will persist well into next year and beyond.
On the inflation front, the headline print of 6.5% for the 12 months to end May means inflation has broken above the SA Reserve Bank’s (SARB) 3% to 6% target range.
“The primary driver of the latest data point was food inflation, while other components in the basket also showed signs of acceleration on a year-on-year basis.”
SARB Governor Lesetja Kganyago recently indicated that a 50 basis point move higher in rates was possible at the upcoming July Monetary Policy Committee meeting. This follows from the bank’s current baseline scenario for a further three 25 basis point hikes at upcoming meetings.
Notable economic data released in June include the SA FNB/BER Consumer Confidence Index, which fell to a reading of -25 for Q2, down from -13 in the previous quarter. This latest reading is well below the long-term average +2 and is the lowest print since Q1 1986. The survey data pointed to a clear deterioration of expectations for both the economic outlook and the outlook for household finances. SA private sector credit extension (PSCE), a measure of private demand growth, slowed marginally in May to an annualised 5.34%, down from 5.87% the previous month. This latest figure is the eleventh straight month of increase in private credit growth. Rising borrowing costs, however, weigh negatively on forward-looking credit growth.
Performance
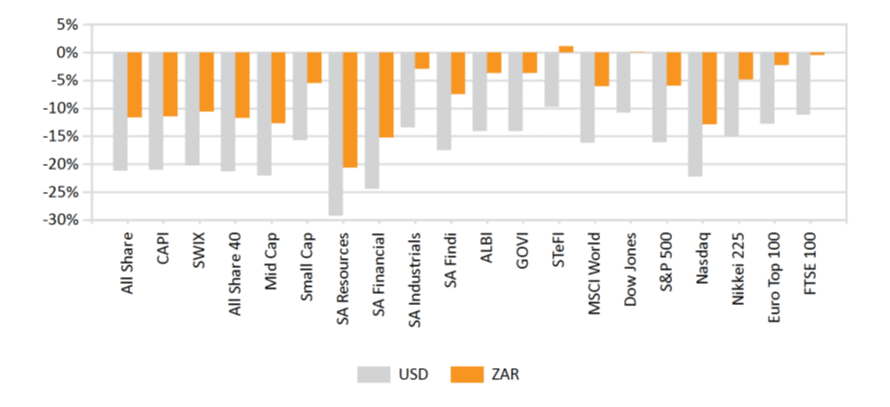
World Market Indices Performance
Quarterly return of major indices

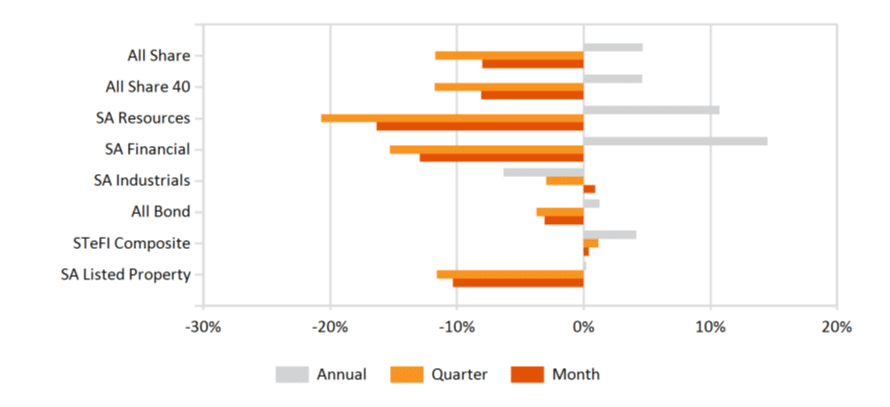
Local Market Indices Performance
Returns of the FTSE/JSE sectors and indices
