Market Commentary: April 2020
Here are this month’s highlights: April was a month of record lows all-round with the global economy forecasted to see its steepest decline since the Great Depression of the 1930s. The South African Reserve Bank reduced the repo rate by a further 100 basis points; South Africa exited the FTSE World Government Bond Index (WGBI) on 30 April; local equity indices rebounded strongly following global peers higher; SA listed property recovered in April in line with equities and bonds; new economy companies such as Amazon, Netflix and Microsoft were net beneficiaries as the world further embraces e-commerce, media streaming and online gaming; and currency performance was mixed.
Market View
Cash
Cash returned 44 basis points (bps) in April. The South African Reserve Bank (SARB), reduced the repo rate by a further 100 basis points (bps) to 4.25% in April. The key reference rate was cut by a cumulative 225 bps this year with further cuts likely to follow as consumer price inflation (CPI), which is largely contained at 4.6% year-on-year to end March, is likely to fall further due to slowing economic activity, subdued international food price growth and a lower crude oil price.
“The SARB’s latest economic growth forecast for 2020 shows a sharp downward revision from only a month ago; its April expectation is for a contraction of 6.1% compared to a contraction of 0.2% in March.”
Such a large negative revision indicates the severity of the lockdown across all sectors of the economy, with rising unemployment expected to further reduce spending by businesses and households in the short- to medium-term. In its latest communications, the SARB continued to emphasise that the outlook, globally and locally, remains fraught with uncertainty, thus future interest rate decisions remain dependent on incoming economic data.
Bonds
Following the Moody’s downgrade to sub-investment grade in late March; Fitch and S&P further downgraded South Africa’s long-term sovereign rating to BB, with a negative outlook, and BB-, with a stable outlook, respectively. Both agencies cited the negative consequences of COVID-19 on the economy while, understandably, questioning the long-term sustainability of rising government debt that has now materially expanded given its COVID-19 fiscal response programmes. Fitch estimates South Africa’s government debt to GDP ratio will rise to 75% by the end of 2020, from its current level of 62%, on track to reach 85% by 2023.
South Africa exited the FTSE World Government Bond Index (WGBI) on 30 April. This event was well-publicised, and investors have had time to prepare accordingly since Moody’s ratings’ announcement in late March.
“The last three months saw a cumulative R74 billion in net selling by foreign holders of government bonds.”
The bulk of this, approximately 80%, took place in March. This likely largely due to a broader sell-off of Emerging Market (EM) debt as part of a massive risk-off wave. Outflows in April amounted to R11 billion, with nominal government yields ending the month lower; the generic 10-year bond yielded 10.2% on 30 April relative to 10.9% at the start of the month. The SARB’s actions in the secondary market, purchases of government debt to ensure sufficient market liquidity and overall stability, has assisted somewhat in driving yields lower. Looking forward, and given continued SARB market intervention, it is likely that most of the repricing of government debt due to the WGBI exit is now behind us.
SA nominal bonds and inflation-linked issues both posted recoveries in April, gaining 3.9% and 4.4%, respectively – per the All Bond and Composite Inflation-linked Bond indices. Local fixed income recovered alongside global bond indices; the JP Morgan Emerging Market (EM) Bond Index rebounded 3.7% (USD) as the massive risk-off wave in March was partially paired back. Developed Market (DM) indices such as the Barclays Aggregate Bond Index added 2.0%, this as the bond markets found a level of stability following a highly volatile month in March.
Equity
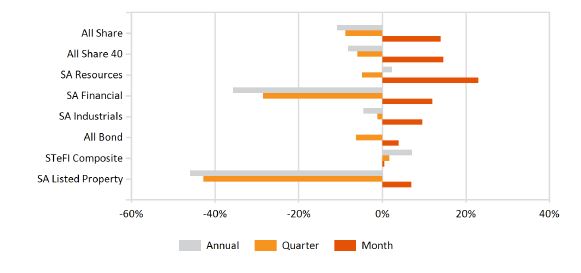
Local equity indices rebounded strongly in April, following global peers higher. The All Share and Capped Shareholder Weighted Index (SWIX) gained 14% and 14.2%, respectively. The resource sector led the rally, up 22.9%, with gold mining companies performing strongly in response to a rising US dollar gold price.
“The financials index gained 12% as bank and life insurance shares partially offset the large losses they incurred in March.”
While the industrial segment rose by 9.6%, the basic material sub-sector gained 23.1% attributable to Sasol’s performance, up by 136.3% in April after an 80% decline the previous month. The rebound across the market capitalisation indices was relatively more subdued; the mid and small cap indices rose 8.5% and 8.8%, respectively.
Property
SA listed property recovered in April in line with equities and bonds; the SA Property Index (SAPY) returned 7%. The sector had rallied by nearly 24% during the month, but fell from this peak as a handful of property companies announced decisions to defer distribution or dividend payments. This after the highly uncertain economic outlook due to COVID-19. Despite the recovery in April, listed property remains down 44.5% year-to-date; the sector has repriced heavily with the persistence of negative sentiment towards it stemming from the first quarter of 2018 when concerns about the Resilient group of companies came to the fore. Globally, the FTSE/NAREIT Developed Rental Index gained 7.1% (USD) for the month.
International Markets
Global equity markets rallied strongly in April, due largely to the coordinated monetary and fiscal policy responses undertaken by central banks and governments in response to the economic impacts of COVID-19. The re-opening of certain developed economies, in the latter part of April, also added to the rebound in financial markets. Of significance on the fiscal policy front for the world’s largest equity market; the US government approved a further $484 billion of support for small businesses and its healthcare system. Cumulative fiscal stimulus in the US amounts to $2.8 trillion thus far in 2020 with further programmes likely to follow as the true economic toll of the virus unfolds over the coming months.
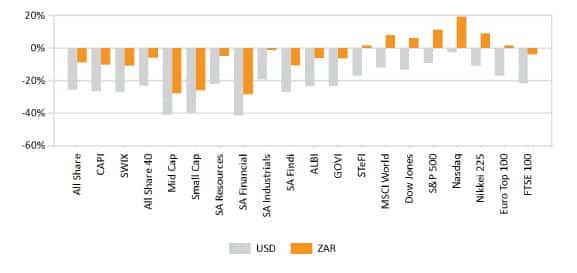
The technology heavy NASDAQ index led the rebound across global equity markets, gaining 15.5% in April and has returned -0.6% year-to-date.
“New economy companies such as Amazon, Netflix and Microsoft were net beneficiaries of the restrictions placed on human movement, as the world further embraces e-commerce, media streaming and online gaming.”
This trend is a global one; for the same reasons, Alibaba and Tencent rallied in April. Closer to home, Naspers, given its significant minority holding in Tencent, also rebounded by 9.4%. Broader equity indices such as the S&P500 closed 12.8% higher, retracing most of its March losses; European indices also rallied, the German DAX 30 Index was up 9% while the United Kingdom FTSE 100 Index rose by 5.8%. The Japanese nikkei 225 Index rebounded by 7.6%. Lastly, EM continued to underperform their Developed peers as the MSCI EM Index returned 9.2%, behind the MSCI World Index, which gained 11%. All returns in USD.
“Supranational institutions such as the International Monetary Fund (IMF) and the World Trade Organisation (WTO) are advising that the global economy is likely to suffer its steepest decline since the Great Depression of the 1930s.”
In its latest quarterly economic outlook, the IMF expects a 3% contraction in global GDP this year, note that an annual global growth rate below 2% is considered recessionary, followed by a 5.8% expansion in 2021. The institution indicated that risks to this outlook remain to the downside, a function of the depth and duration of the effects of COVID-19 on economic activity and, by extension, financial markets. For its part, the WTO estimates global trade to contract by between 13% and 32% in 2020, with a recovery of 21.3% in 2021.
Unemployment data in the US and across the European Union (EU) has been dismal, with almost all these datapoints substantially exceeding market estimates to the downside. For example, weekly recurring unemployment claims in the US exceeded 22 million by end April, a level never experienced before and nearly four times the peak reached during the Global Financial Crisis (GFC).
Currencies and Commodities
The COVID-19 outbreak has led to a dramatic fall in the demand for oil; daily global demand in early 2020 was estimated to be 100 billion barrels per the Energy Information Agency (EIA). Current estimates show this figure to be 25% to 35% lower, given the reduction in economic activity due to the virus. Meanwhile, reductions to supply were slow, with the price-war between Saudi Arabia and Russia, which started in March exacerbating the supply glut. All of this has a meant rapid stockpiling of excess supply by producers, storage facilities and the use of oil tankers at sea. This is the context that resulted in negative US oil prices, West Texas Intermediate (WTI) in April. Specifically, the May WTI futures contract reached an intra-day low of $-37 per barrel due to the lack storage capacity at a key storage facility in Cushing, Oklahoma in the US. This event was highly anomalous; having never occurred in the 37-year history of oil futures trading. As such it should not be read into too deeply, however, should it occur with any regularity it would have material negative implications for the global economy and all financials markets by association.
“Commodities more broadly ended April flat, this per the Goldman Sachs Commodities Index (GSCI); unlike financial assets, which rebounded over the month.”
Brent crude oil rose by 11.1%, unlike its US counterpart, WTI closed the month lower for reasons noted above. The Brent crude month-end price of $25 per barrel remains well below the average break-even price for most oil producing countries of approximately $50 per barrel. Precious and industrial metals such as gold, silver and platinum all rose in April, up 6.9%, 7.1% and 7.5%, respectively.
Currency performance was mixed in April; EM currencies suffered further weakness against the world reserve currency, the South African rand weakened by 3.7% and Brazilian real by 5.1% for example. DM currencies broadly gained against the USD, the Australian and New Zealand dollars led these gains, appreciating by 6.2% and 2.9%, respectively.
Performance
World Market Indices Performance
Monthly return of major indices

Local Market Indices Performance
Returns of the FTSE/JSE sectors and indices

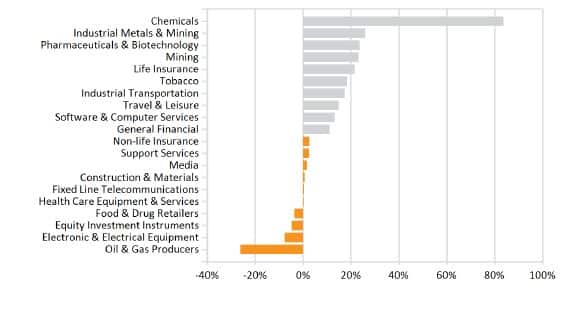
Monthly Industry Performance
